In today’s fast-paced digital world, the performance of your web applications can make or break your business. Slow or unresponsive websites and applications can drive away users, resulting in lost revenue and a damaged reputation. To ensure your web applications can handle the traffic they’re expected to receive, load testing is crucial.
Apache JMeter, a popular open-source tool, is widely used for load testing and performance testing of web applications. In this article, we’ll explore load testing best practices with JMeter to help you ensure peak performance for your applications.
What is JMeter?
JMeter, developed by the Apache Software Foundation, is an open-source tool designed for performance testing, load testing, and functional testing of web applications.
It allows you to simulate multiple users accessing your application concurrently, helping you identify bottlenecks, performance issues, and weaknesses in your system.
Why Load Testing Matters
Before diving into load testing best practices with JMeter, let’s understand why load testing is essential:
1. Performance Assurance
Load testing ensures that your web application can handle the expected user load without degradation in performance.
For example, imagine an e-commerce website preparing for a Black Friday sale. Load testing helps ensure that the website doesn’t crash or slow down when thousands of users are trying to make purchases simultaneously.
2. Identifying Bottlenecks
It helps in pinpointing bottlenecks and weaknesses in your infrastructure or application code.
For instance, if your application’s database struggles to handle concurrent requests, load testing will reveal this as a performance bottleneck, allowing you to optimize the database queries or scale your database infrastructure.
3. Optimization
By uncovering performance issues, load testing provides valuable insights for optimization, ensuring a smoother user experience.
Let’s say you run an online streaming service. Load testing can reveal buffering issues during peak usage, prompting you to optimize video delivery for better performance.
4. Capacity Planning
Load testing assists in capacity planning by determining how many concurrent users your application can support. For a subscription-based software service, knowing your application’s capacity helps you allocate resources efficiently, avoiding server overloads.
Now that we recognize the importance of load testing, let’s explore the best practices for conducting effective load tests with JMeter.
Performance Testing vs. Performance Engineering: The Crucial Differences
Load Testing Best Practices with JMeter
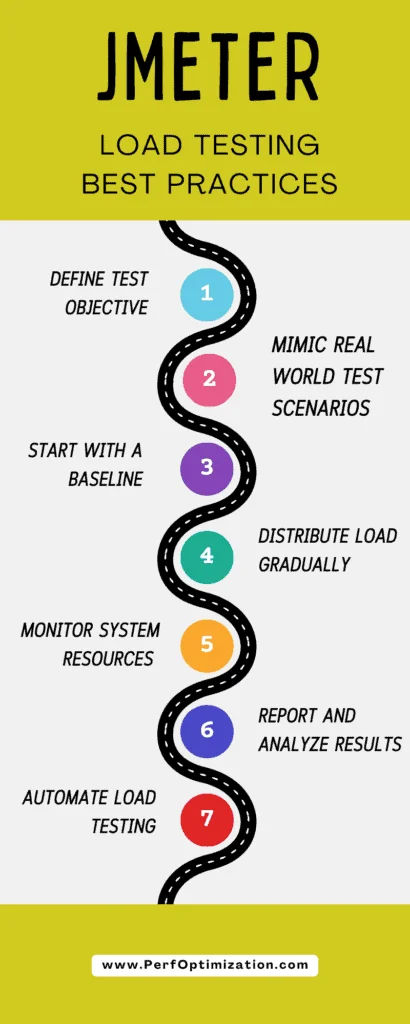
1. Define Clear Objectives
Before starting any load test, establish clear objectives and performance benchmarks. Determine what metrics you want to measure, such as response time, throughput, and error rate. Having well-defined goals will guide your testing process and help you interpret the results effectively.
2. Design Realistic Test Scenarios
Create test scenarios that mimic real-world usage patterns. Consider factors like
- User Behavior: In real-world scenarios can be quite diverse. To create realistic test scenarios, consider different types of users and their behaviors:
- User Roles: Identify and simulate various user roles within your application. For example, an e-commerce site may have customers, guest users, and administrators. Each role interacts differently with the system.
- User Flows: Analyze typical user journeys through your application. For instance, an e-learning platform may have users who log in, browse courses, take quizzes, and submit assignments. Simulate these flows to mimic real user interactions.
- User Think Times: Different users may take different amounts of time to perform actions. Some may browse quickly, while others may spend more time reading or contemplating. Incorporate varying think times to simulate these differences realistically.
- Peak Traffic Hours and Seasonal Variations: Real-world applications often experience fluctuations in traffic due to peak hours, promotions, or seasonal events. To account for this:
- Identify Peak Hours: Determine the peak hours or days when your application experiences the highest traffic. Schedule load tests to simulate these peak loads to ensure your system can handle the increased demand.
- Seasonal Traffic: If your application experiences seasonal variations (e.g., holiday shopping spikes), plan load tests accordingly. Seasonal load testing helps ensure your system’s stability during critical periods.
- Geographical Distribution: In today’s globalized world, users can access your application from different geographical locations. To mimic this diversity:
- Use Geographic Load Balancing: Implement load balancing that distributes virtual users across multiple geographical regions. For instance, if your application serves customers in North America, Europe, and Asia, distribute the load accordingly.
- Latency Simulation: Recognize that users from distant locations may experience higher latency. Use JMeter to introduce latency in requests, simulating the delay experienced by users accessing your application from remote areas.
- Varying Network Conditions: Real-world network conditions can vary widely. To create realistic scenarios, consider factors like:
- Network Speed: Simulate different network speeds (e.g., 4G, 3G, 2G) to see how your application performs under various conditions. This is especially crucial for mobile apps.
- Network Errors: Introduce network errors, such as packet loss or intermittent connectivity, to test how gracefully your application handles network disruptions.
- Device and Browser Diversity: Users access applications from various devices and browsers. Ensure that your test scenarios reflect this diversity:
- User Agents: Configure JMeter to use different user agents to simulate requests from various browsers and devices. This helps you identify compatibility issues and optimize for different platforms.
- Responsive Design Testing: If your application is responsive, test it on different screen sizes and resolutions to ensure it renders correctly on various devices.
By considering these factors and using JMeter’s controllers and samplers effectively, you can design test scenarios that closely resemble real-world usage patterns. This approach enables you to identify performance bottlenecks and make informed optimizations to deliver a seamless user experience under diverse conditions.
3. Start with a Baseline Test
Begin with a baseline test to establish your application’s performance under normal conditions. This provides a reference point for identifying performance deviations during subsequent load tests.
For example, if your baseline test shows a response time of 2 seconds for a specific request, you can monitor how this response time changes under heavier loads.
4. Distribute Load Gradually
Avoid overwhelming your application with a sudden surge of virtual users. Gradually increase the load to simulate a natural traffic ramp-up. This approach helps identify the breaking point and gradual degradation of performance.
Suppose you’re load testing a ticket booking website. Start with a small number of users and gradually increase them to simulate the gradual increase in ticket reservations as the event date approaches.
5. Monitor System Resources
Use JMeter’s built-in monitoring tools or integrate with external monitoring solutions to track system resources like;
- CPU Usage:
- What it measures: CPU usage refers to the percentage of CPU (Central Processing Unit) resources consumed by your application and its associated processes during a load test.
- Why it’s important: High CPU usage can indicate that your application is processing requests inefficiently or that certain operations, such as complex calculations or database queries, are consuming excessive CPU resources.
- Actions to take:
- Profile your application to identify CPU-intensive code sections.
- Optimize algorithms and database queries that are CPU-bound.
- Consider horizontal scaling by distributing the load across multiple servers or instances to alleviate CPU pressure.
- Memory:
- What it measures: Memory usage refers to the amount of RAM (Random Access Memory) being used by your application. It includes both the heap memory (Java heap for Java-based applications) and non-heap memory (for objects like threads and classes).
- Why it’s important: Excessive memory usage can lead to memory leaks or inefficient memory management, causing your application to slow down or eventually crash.
- Actions to take:
- Use memory profiling tools to detect memory leaks and identify areas of high memory consumption.
- Optimize object creation and disposal to reduce memory pressure.
- Adjust JVM heap settings for Java applications based on memory usage patterns.
- Network Activity:
- What it measures: Network activity includes metrics like bandwidth usage, data transfer rates, and the number of network connections established during a load test.
- Why it’s important: High network activity can indicate inefficiencies in data transfer between application components, excessive external service calls, or inefficient use of network resources.
- Actions to take:
- Profile network interactions to identify bottlenecks, such as slow external service calls or excessive data transfer.
- Consider optimizing network protocols and reducing unnecessary data transfers.
- If applicable, consider using content delivery networks (CDNs) or edge caching to offload network traffic.
Additionally, when monitoring these resource metrics, it’s essential to establish baselines for expected resource utilization under normal conditions. This baseline provides a reference point for identifying abnormal behavior during load testing.
Integrating JMeter with external monitoring solutions or utilizing JMeter’s built-in monitoring tools like the “jp@gc – PerfMon Metrics Collector” or “Backend Listener” can help you collect and visualize these metrics in real-time during load tests.
By correlating performance issues with resource constraints, you can take proactive steps to optimize your application, infrastructure, or test scenarios for better performance and scalability.
Monitoring these metrics helps correlate performance issues with resource constraints. For instance, if CPU usage spikes during a load test, it may indicate that your application’s code or database queries need optimization.
6. Use Assertions for Validation
Implement assertions in your test plan to validate the correctness of server responses. Assertions can check whether the expected content or HTTP status codes are returned, ensuring the application functions as intended under load. For a healthcare portal, you can use assertions to verify that patient records are displayed correctly for different users under load.
7. Parameterize Test Data
Parameterize test data to simulate dynamic user behavior. This allows you to test various scenarios by changing input values (e.g., user names, search queries) within your test plan, making it more realistic. Suppose you’re testing a social media platform. Parameterize user data to simulate different users posting messages, each with unique content and characteristics.
8. Implement Think Time
Incorporate think time between user interactions to simulate real user behavior. Think time represents the pauses users take between actions, such as reading content or making decisions, and prevents unrealistic rapid interactions. For an e-learning platform, adding think time between quiz questions simulates the time students take to think before answering.
9. Report and Analyze Results
Generate detailed test reports and analyze the results thoroughly. JMeter provides various listeners and reporting options. Pay close attention to response times, error rates, and throughput to identify performance bottlenecks.
For a financial services application, analyze the response times for transactions to ensure they meet regulatory requirements.
10. Rerun Tests and Iteratively Optimize
Load testing isn’t a one-time activity. Rerun tests after making optimizations and improvements to your application or infrastructure. Continuously iterate to achieve better performance. If you run an e-commerce site, rerun load tests after optimizing the checkout process to ensure faster order processing during high-traffic periods.
11. Consider Scalability Testing
If your application is expected to grow, conduct scalability tests to assess how it performs when scaled horizontally or vertically. JMeter can help you simulate increased server capacity and monitor the system’s response. For a cloud-based file storage service, scalability testing ensures that the system can handle the addition of more storage nodes as user data grows.
12. Automate Load Testing
Integrate JMeter with your continuous integration/continuous deployment (CI/CD) pipeline for automated load testing. This ensures that performance testing is an integral part of your development process. For a software-as-a-service (SaaS) platform, automated load testing can be triggered automatically after each code deployment to catch performance regressions early.
Conclusion
Load testing with JMeter is a powerful method for ensuring the peak performance and reliability of your web applications. By following these best practices and considering the real-world examples provided, you can identify and address performance issues early in the development cycle, optimize your application for scalability, and deliver an exceptional user experience. Remember that load testing is an ongoing process, and regularly reviewing and updating your test plans is key to staying ahead of performance challenges in today’s dynamic digital landscape.
Read More:
Performance Testing vs. Performance Engineering: The Crucial Differences
Power of Performance Testing with k6: A Comprehensive Guide
The Ultimate Guide to Load Testing: Ensuring Your Digital Success